[EN] Dog monitoring solution
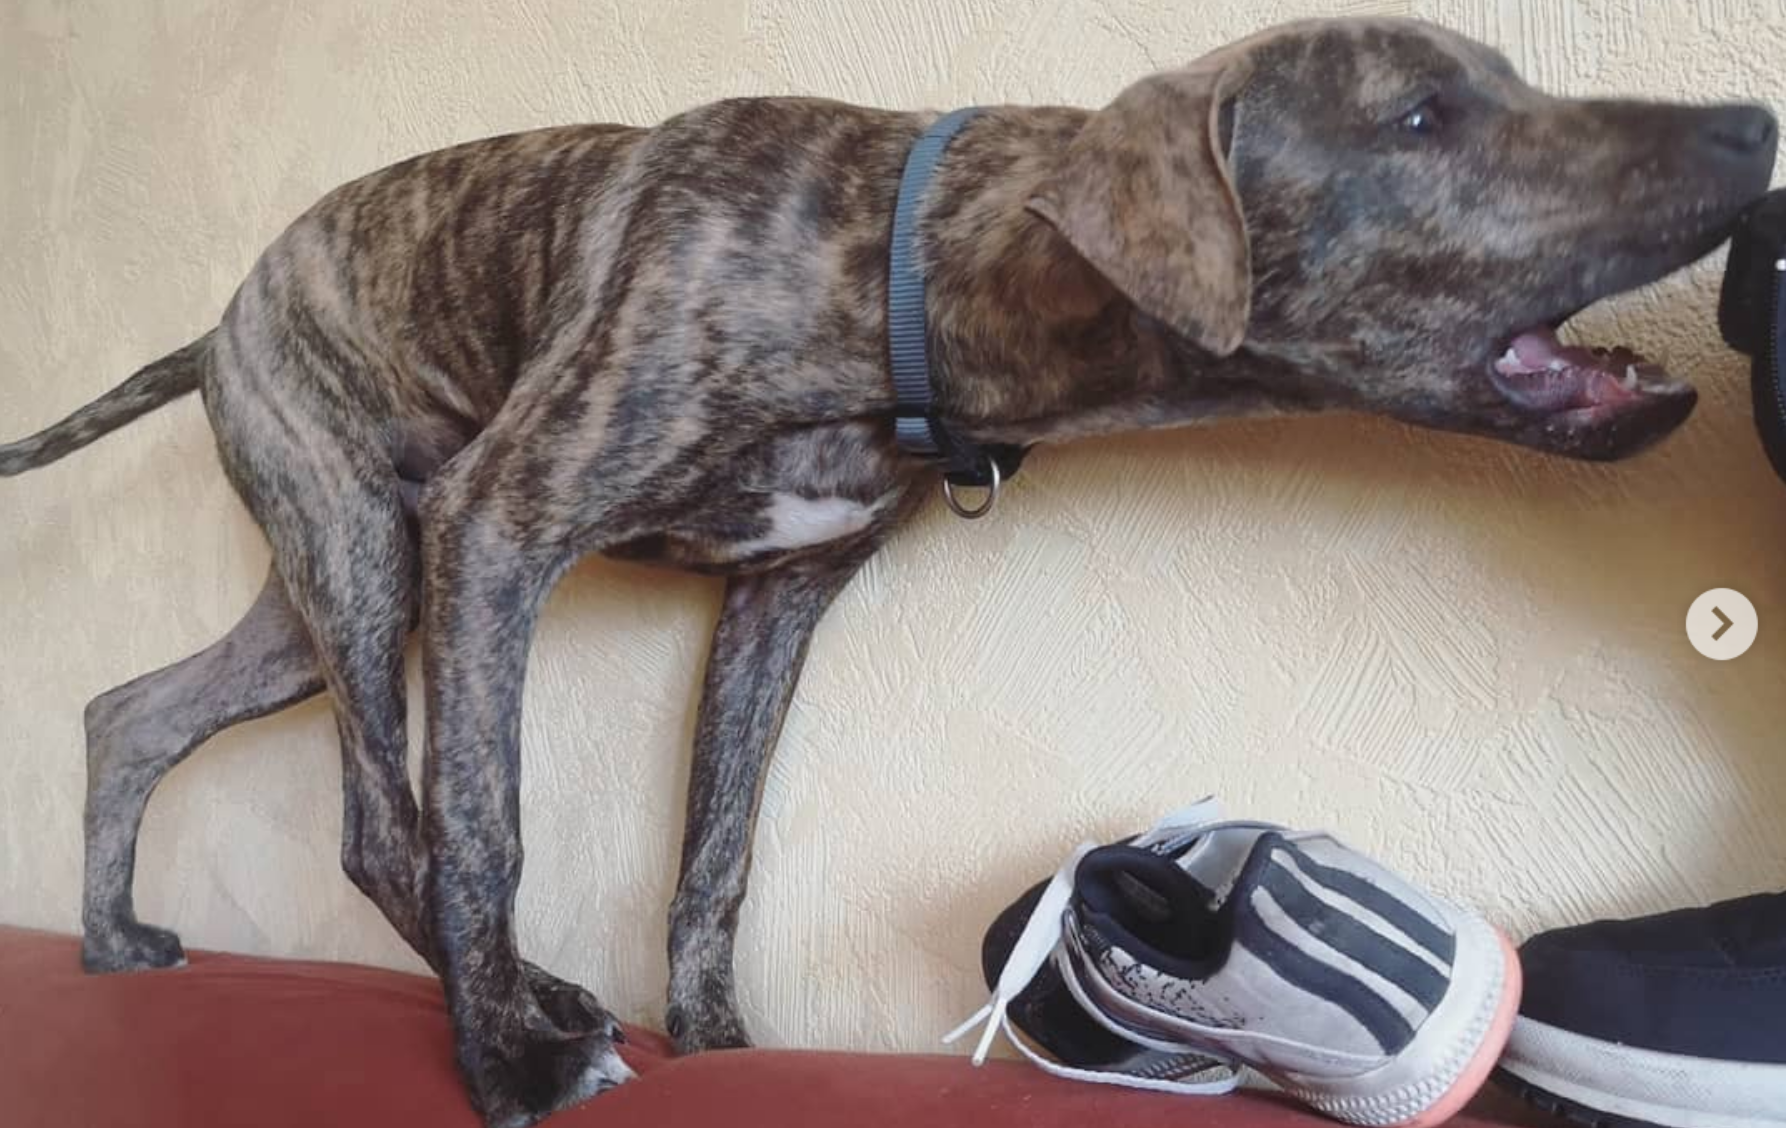
Yeah, I have a dog. A really lovely and fun one named Loki, but sometimes he drives me and my girlfriend crazy. The background of this story is following: neighbours started to complain about some dog noises during the day. Of couse I had faith in my dog and knew that although he is very noisy sometimes, he wouldn’t do that. And I was right - one of my neighbours recently got a young dog and he did all that mess. However, I wanted to check how our dog is performing in terms of noise levels when we are out, so I have implemented a monitoring approach to test that and answer this question in a data-driven manner.

So, I want to track sound level during the day, what should I do? At first I tried recording audio and seeing the soundwave graph after the day - the results were as I expected: some random woofs during the day, several woofs during the lunch and around 5 PM. It’s good for one-time checks, but I’m not particularly interested how woofs sound - I just want to know when the woofing occured. Moreover, audio recordings are very space consuming. Ideally, I want just to measure decibels and write the output somewhere.
There is an open source library written in python and called soundmeter. It’s a really simple command line tool, where you can set the frequency along with other parameters and get the output in real time - basically all I needed. Since this data won’t take much space, I simply wrote the output to plain text file (of couse I could use some streaming technologies e.g. Apache Kafka, but it would be like killing a fly with a bazooka). The setup is fairly easy - just need to install soundmeter via pip tool:
pip install soundmeter

Then I put my microphone next to my buddy’s cage (yeah, we leave our dog in a cage for his own safety). Since Loki is in the same place during the whole day, it’s really convenient from the monitoring and safety perspective. I wrapped this command line application in bash script for easier execution - all I need to do is to run this script and leave my pc on:
#!/bin/sh
soundmeter --segment 0.5 --log /dev/stdout 2>/dev/null | unbuffer -p perl -p -e 's/\s*(\d+)\s+(.{19})(.*)/"$2,". 20*log($1)/e' >> `date +"%m-%d-%Y"`_loki.log
I’ve been tracking my dog’s sound level for several months during the work days and came up with some pretty good amount of data. Since the output is in separate files, let’s map all these files to read_csv function (yey, some functional programming finally):
filenames <- list.files("data/", full.names = TRUE)
data <- map_df(filenames, function(f){
  read_csv(f, col_names = c("time", "db")) %>%
    na.omit()
})
The microphone is not calibrated and the amount of decibels does not really reflect the reality, but it’s good for identifying the spikes (woofing periods or just making some noice in the cage). In order to visualize that, lets plot a histogram and you will see what I’m talking about:
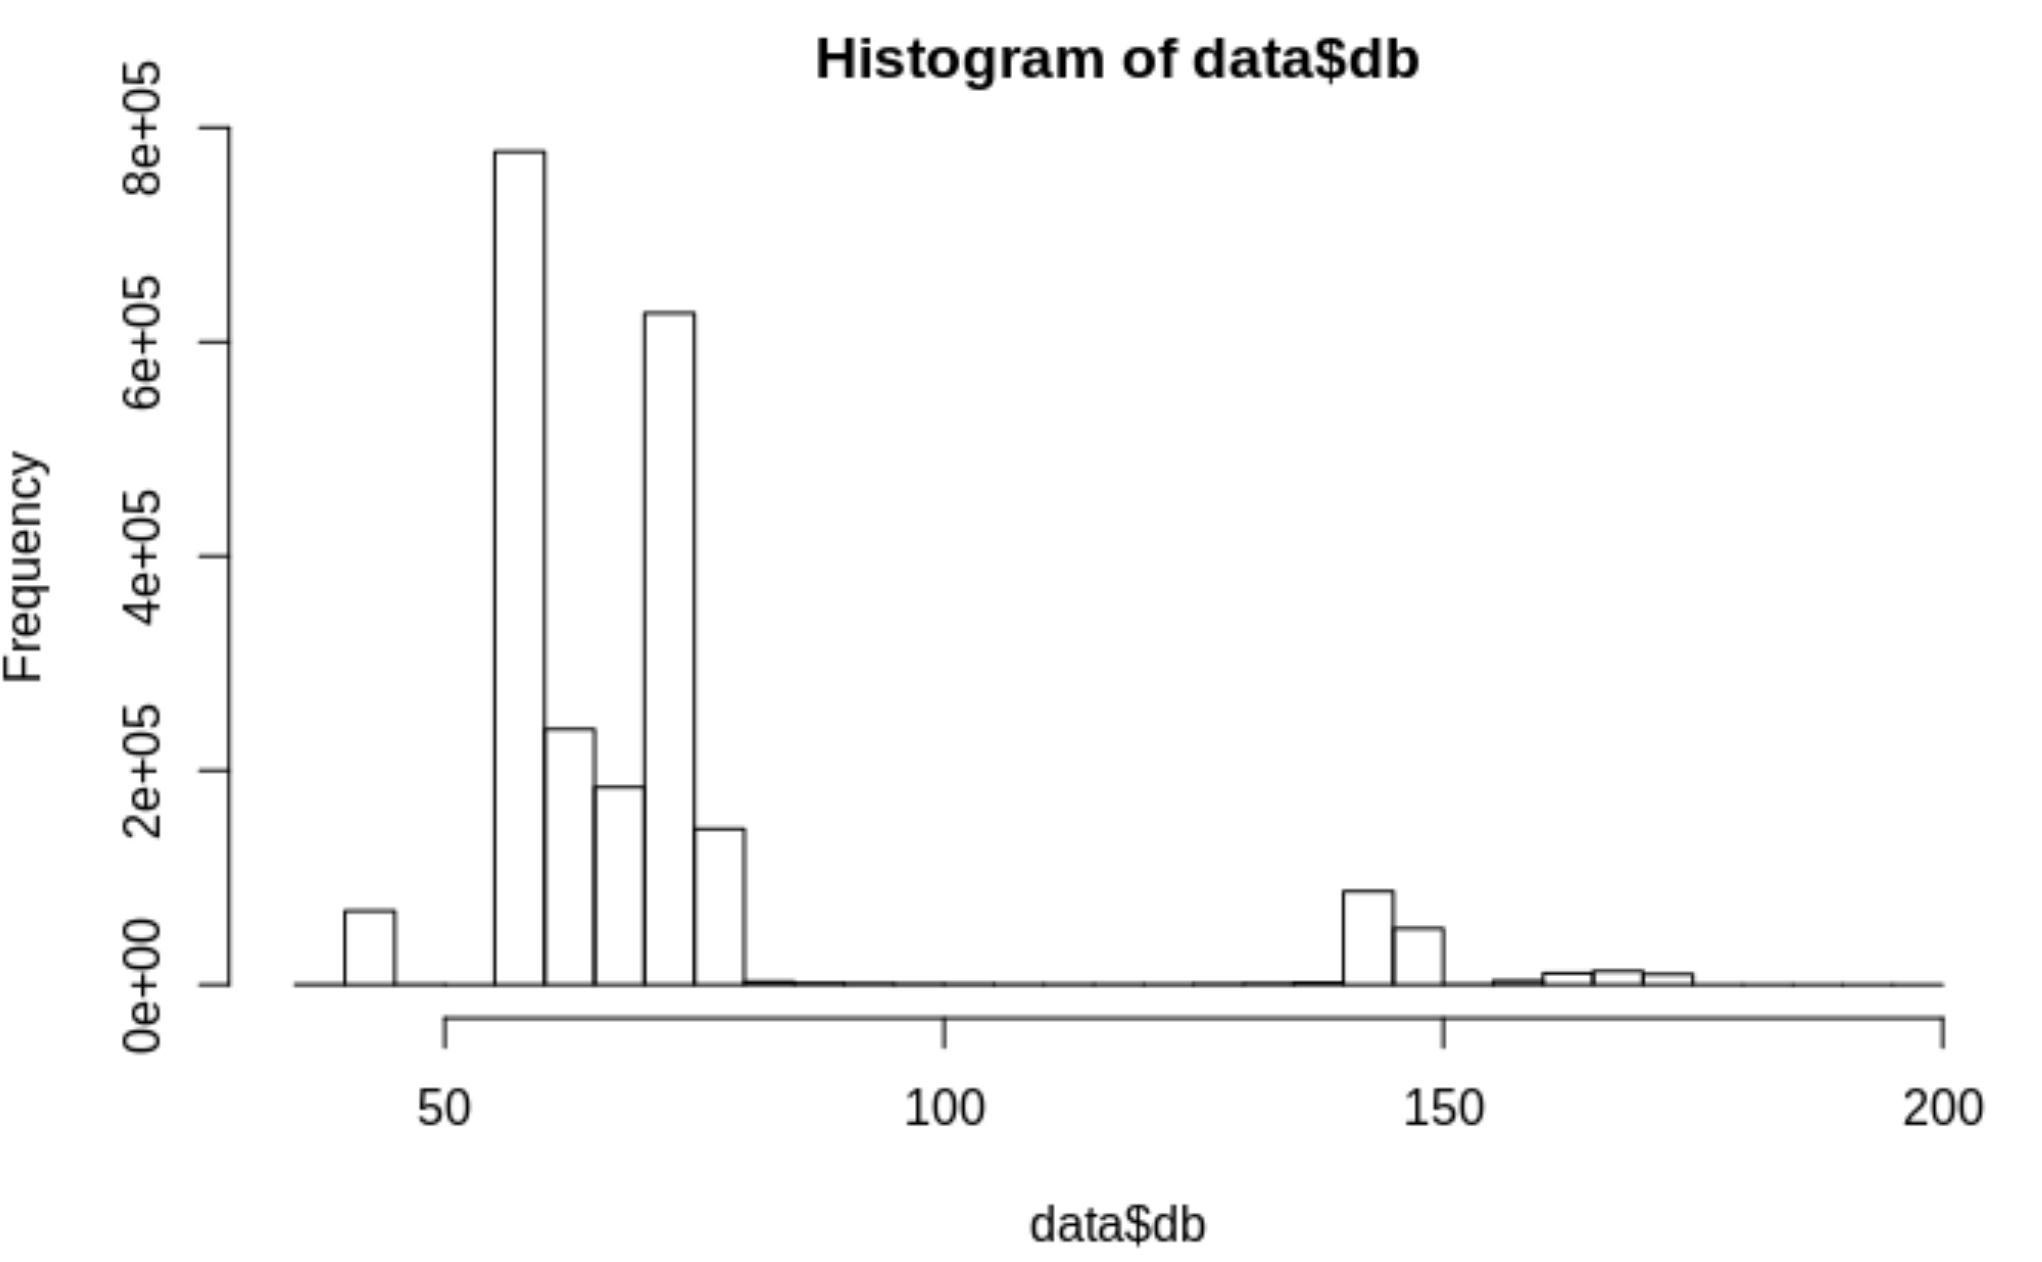
From histogram it’s really easy to identify two clusters - resting and messing around (barking) time. I’ll show you just a few lines of R code, because it’s really self-explanatory (R code in tidyverse is basically a short story about the data journey). Although the threshold of 100 is subjective, it does the trick for this purpose. I also made my dog to bark in order to see what level is reached and it proved my hypothesis as well - it’s way above 100 when the microphone is near his head.
data <- data %>%
  mutate(day = weekdays(time)) %>%
  filter(!day %in% c("Sunday", "Saturday") & hour(time) >= 9 & hour(time) < 18) %>%
  mutate(status = ifelse(db > 100, "Barking", "Resting"))
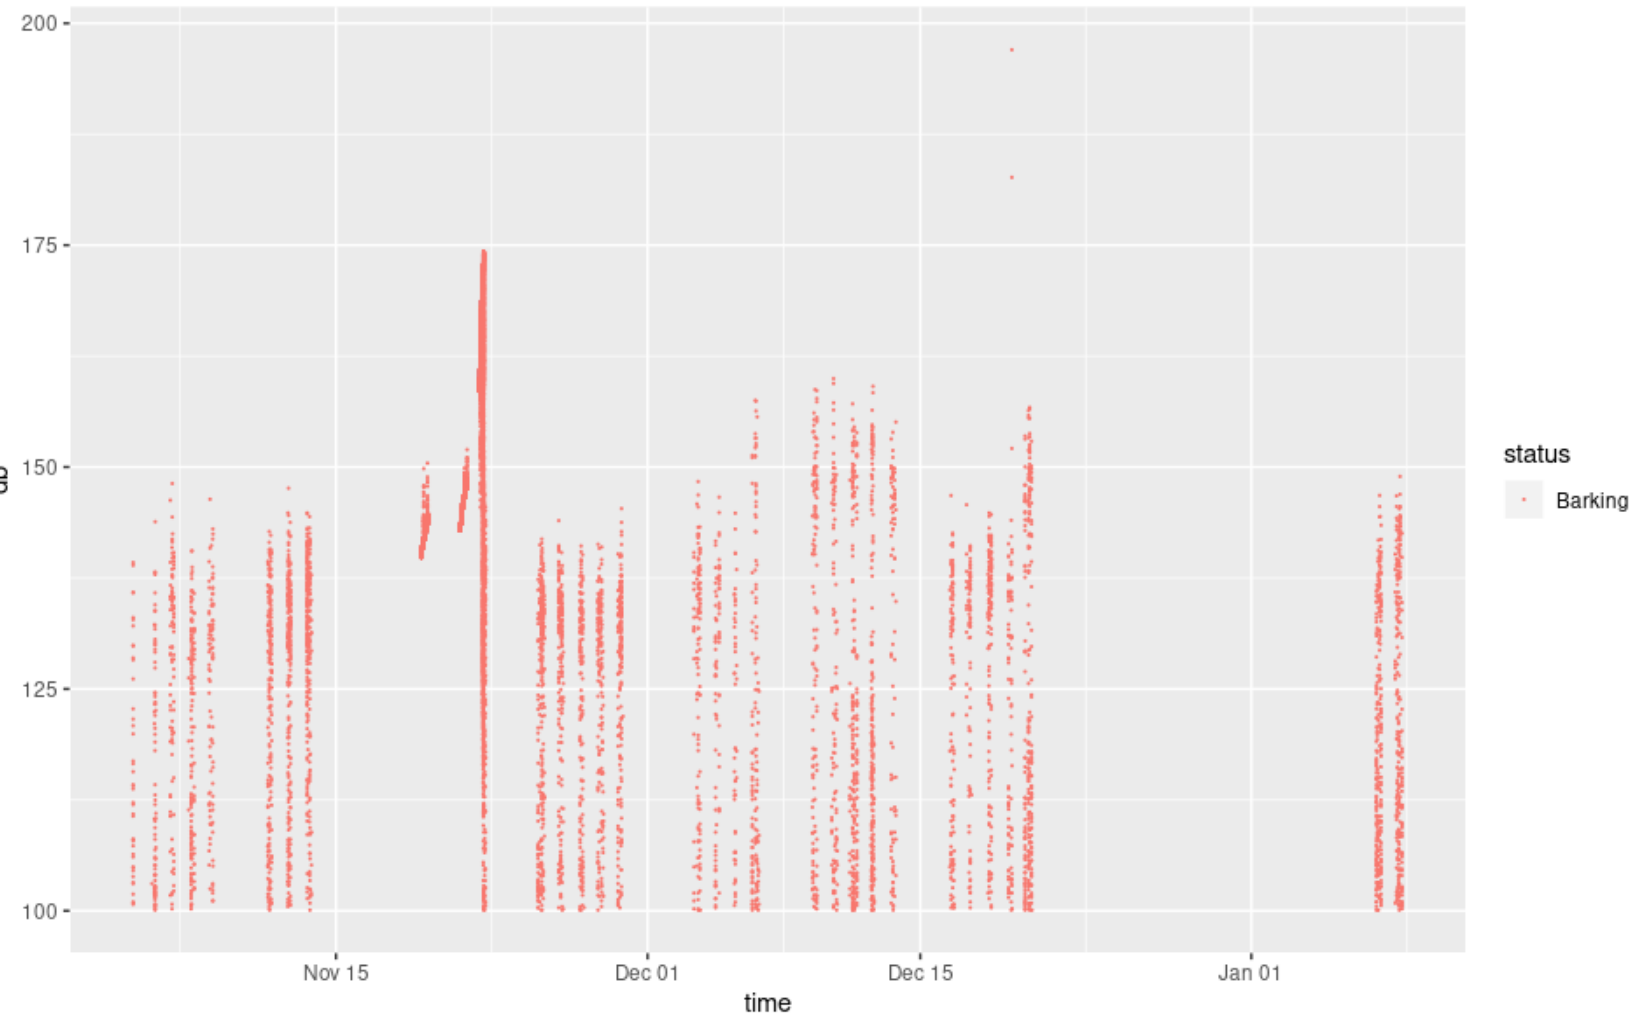
Let’s plot barking patterns now. From there, we can already identify data quality issues - probably I have turned on monitoring script when I was at home, this is why some days in November looked like a really noisy day from a dog’s perspective (plotting data really lets you to see the big picture).
data %>%
  filter(status == "Barking") %>%
  ggplot() +
    geom_point(aes(time, db, color = status), size = 0.1)
Let’s filter out these days and calculate barking percentage:
data_clean %>%
  group_by(status) %>%
  summarise(percentage = round(n()/nrow(data_clean) * 100, 2)) %>%
  kable()
The numbers are similar to what I have expected - he is really quiet when he is waiting for us to come back from work. Only 0.24% of the time Loki is a bad boy.
| status | percentage |
|---|---|
| Barking | 0.24 |
| Resting | 99.76 |
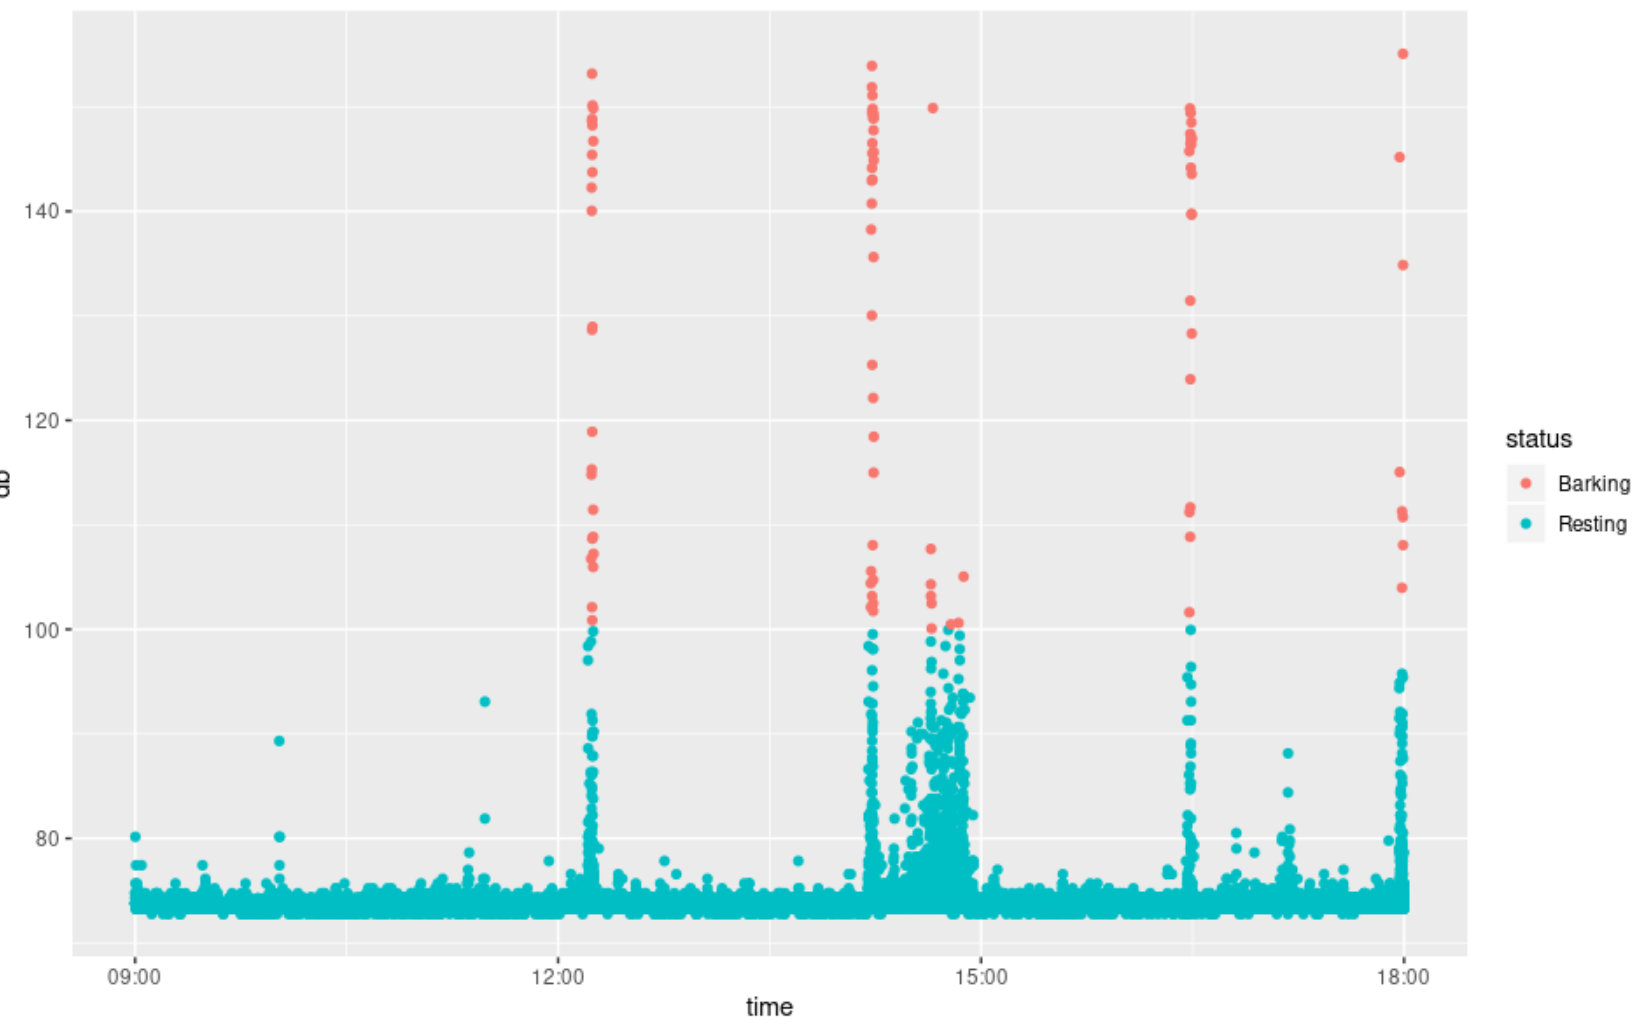
To see how his ordinary day looks like, I have plotted a random instance from Loki’s life. At noon he probably smelled some food and did few woofs, decided to do some workout before 3 PM and heard some squirrels in the evening. Normally we come back from work at 6 PM, so we either entered the room or he was just anxiously waiting for his masters.