Augmented reality pool table
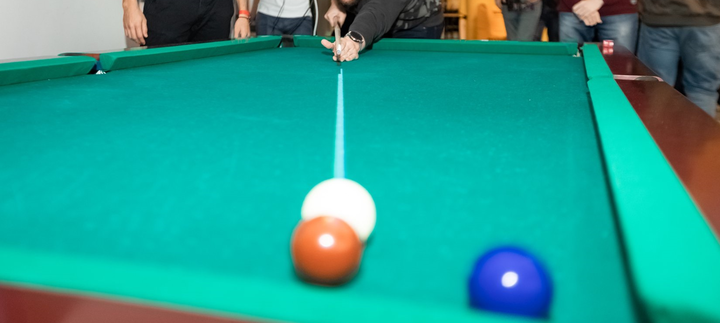
Can you draw a pool table and make some real-time dashboards? “Sure I can.”
The whole project was a huge team effort! However, the interesting part for me was creating real-time visualizations from a data stream. I can tell you a secret - it’s the reactivePoll function in shiny server. How to draw a table, some balls and a path? The ggplot2 comes to the rescue with just a few lines of code.

Dbplyr package helped to summarise statistics and DT for table visualization - just in a few lines of code as well.
